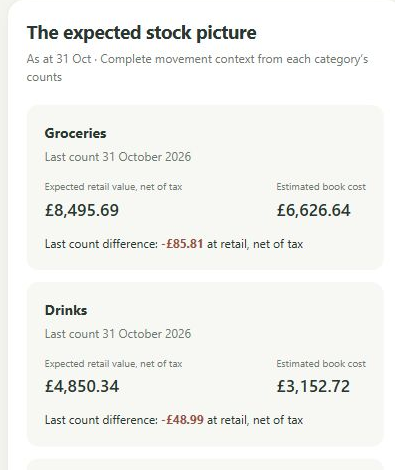
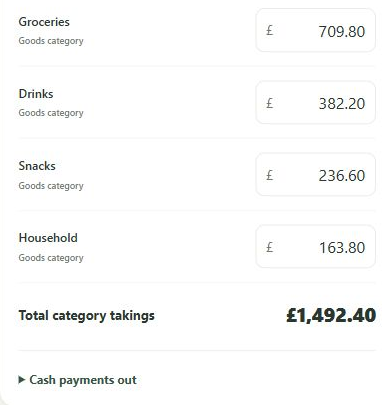
A low-margin category can dominate the sales report while another, smaller category contributes a substantial share of gross profit. Seeing both is useful for an owner deciding where to direct attention. It also helps to be precise about the percentage used: gross margin and markup measure different things.
Use the right denominator
Consider an illustrative item costing £6 and selling for £10, with both figures excluding sales tax. The £4 gross profit is a 40% margin because £4 is 40% of the £10 selling price. The markup is about 66.7% because £4 is about 66.7% of the £6 cost. Using a markup percentage where a margin is expected would overstate the estimate.
Know My Shop's category margin assumptions are gross-margin percentages. A sensible starting assumption should reflect the category's expected selling prices and costs, rather than a percentage remembered without its meaning. Where a category contains very different products, the mix of what sells also affects the margin achieved.
Compare contribution as well as sales
In an illustrative period, £8,000 of sales at a 15% margin gives £1,200 of gross profit. £4,000 at a 35% margin gives £1,400. The smaller category contributes more gross profit in that example. It does not follow that it is more profitable after every relevant overhead, or that it could replace the sales of the other category.
The comparison does, however, change the question. You might review the space each category uses, how promotions affect the mix, or whether customers buy the categories together. A category report provides a clearer basis for that conversation than the grand total alone.
Keep assumptions visible
Know My Shop uses your own category headings and records the relevant settings with historical entries. Changing a category's current assumption should not quietly rewrite the assumptions behind earlier records. The aim is a report you can relate to the conditions that applied at the time.
Applying a target margin to recorded sales estimates a contribution. It does not prove that buying costs, discounts, losses and the actual sales mix delivered that margin. Adding purchases and appropriately dated stock counts supports a count-adjusted view. That remains category management information, with the limitations of its valuation assumptions, rather than a complete set of accounts.
A practical app for the person running the shop.
Keep your existing till. Use your own categories. Build your management picture from familiar daily totals.
See how Know My Shop worksWant a clearer picture of your own shop?
Keep your existing till and explore what category-level management information could do for your business.
Register your interest